-
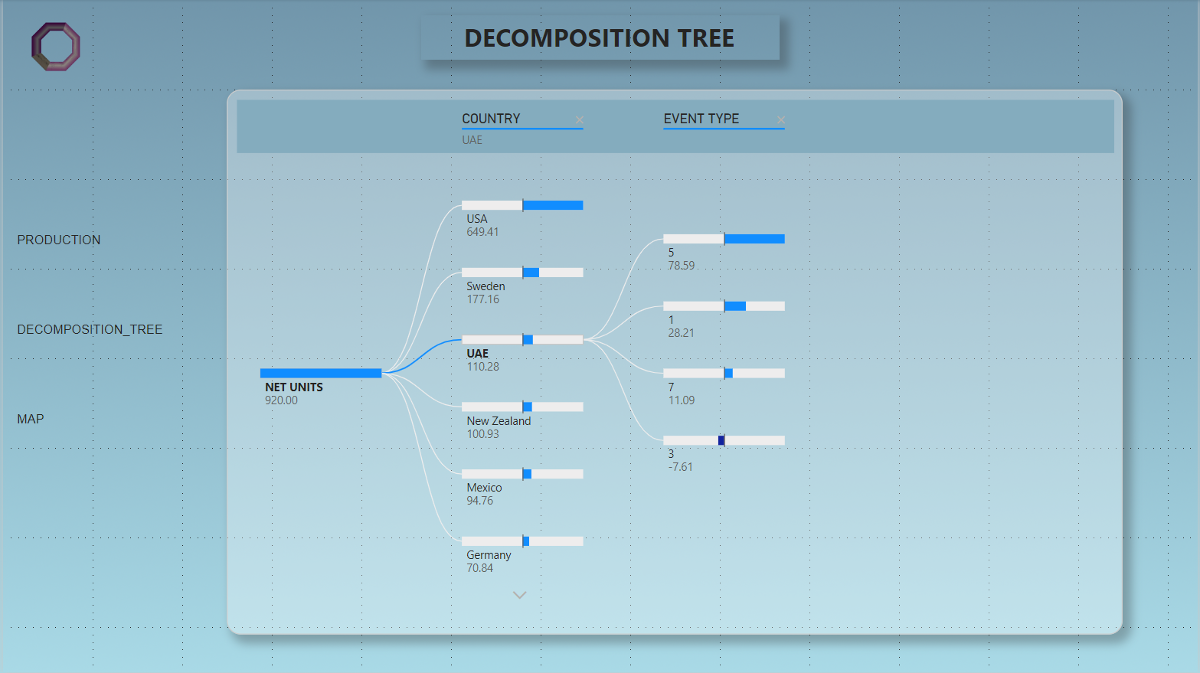
DECOMPOSITION TREE
microsoft 365 | power bi | power query
-
cube_one | rotating dancing cubes
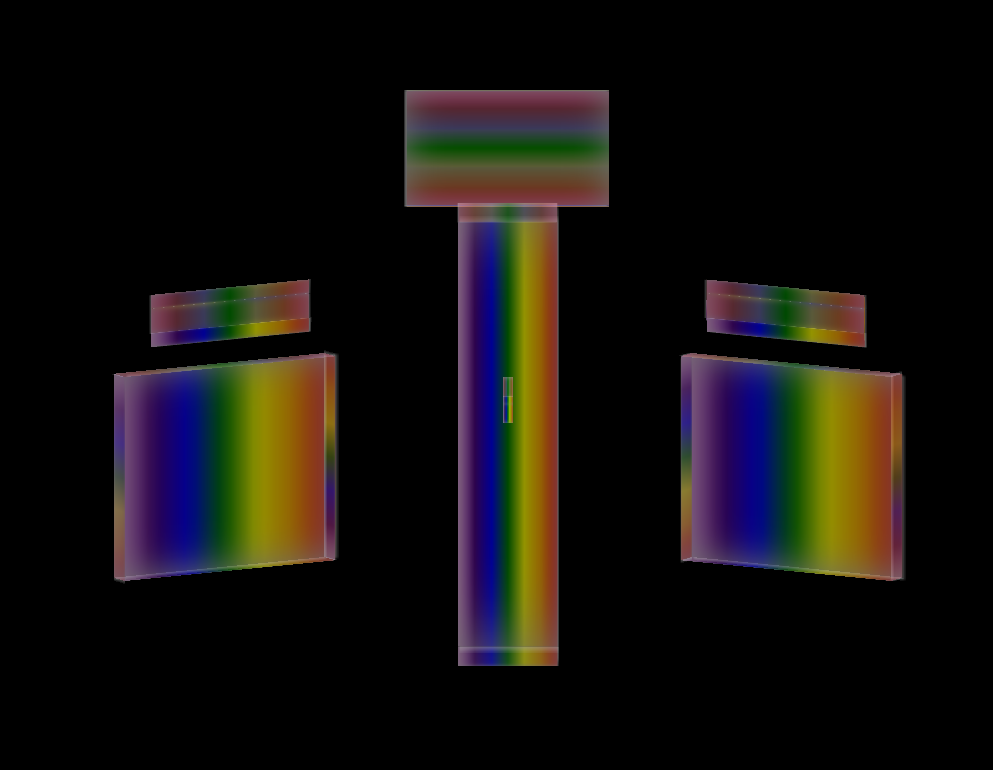
A set of dancing frosty wire cubes that will rotate to display the face you choose. The CSS cubes spin…
-
transition
transition uses CSS Transform to tell the story of our hero’s awakening from slumber. Pitch, yaw, roll and full three-dimensional…
-
graph zero eight | full traversal
graph zero eight again leverages HTML 5, Javascript, CSS and JSON to achieve full traversal of our three-dimensional dataset visualization.…
-
graph zero seven | skew
graph zero seven skews our three-dimensional graph along the X and Y axes. HTML 5, JavaScript and CSS provide the…
-
graph zero six | scale
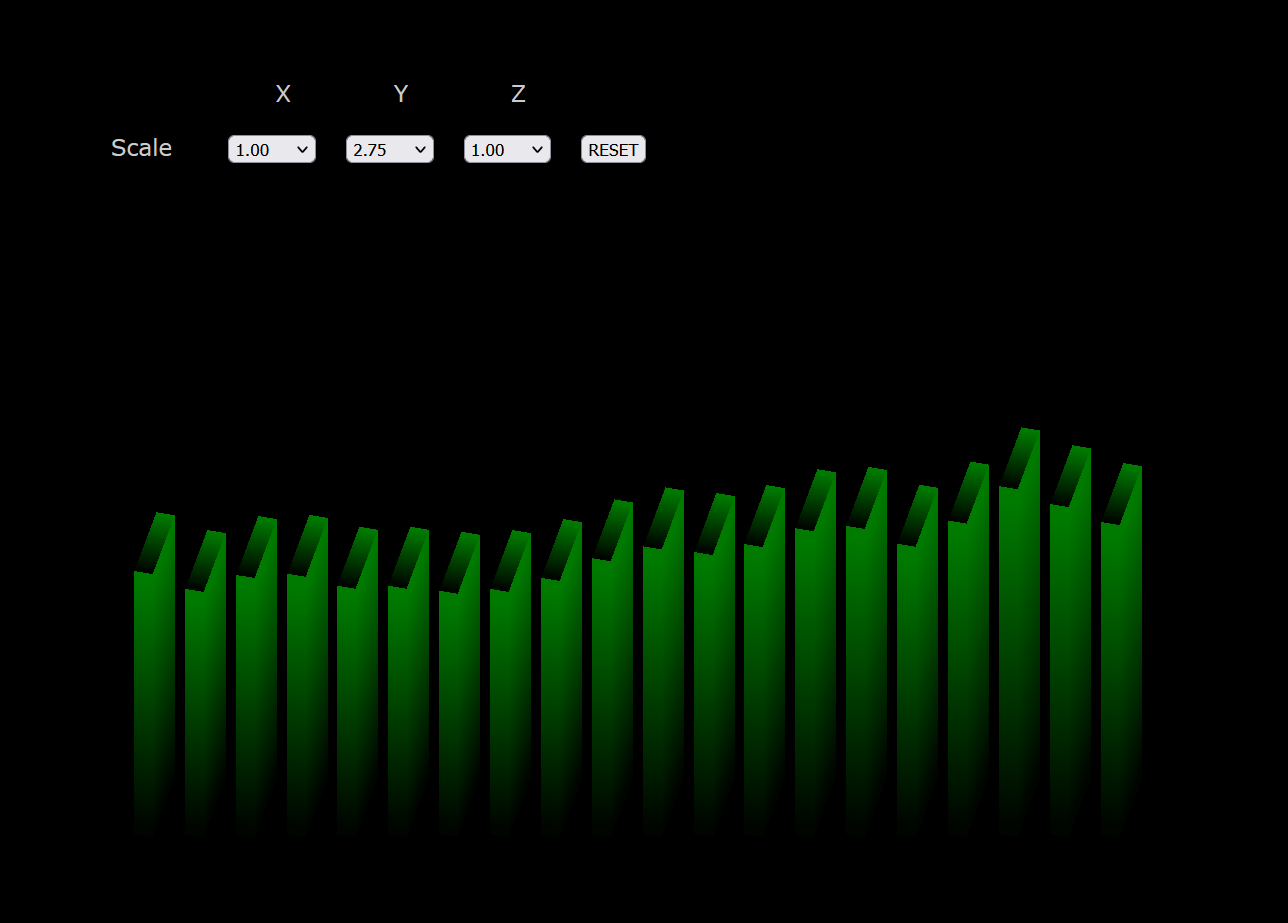
the graph zero six visualization uses our JSON dataset, our base of HTML 5, JavaScript, and the CSS Transform API…
-
graph zero five | rotate
the user rotates our graph zero five visualization along the X, Y, and Z axes by way of HTML 5,…
-
graph zero three | three dimensions
graph zero three is another bar graph visualization of our JSON dataset in three dimensions, courtesy of HTML 5, JavasScript,…


