-
graph standard | div
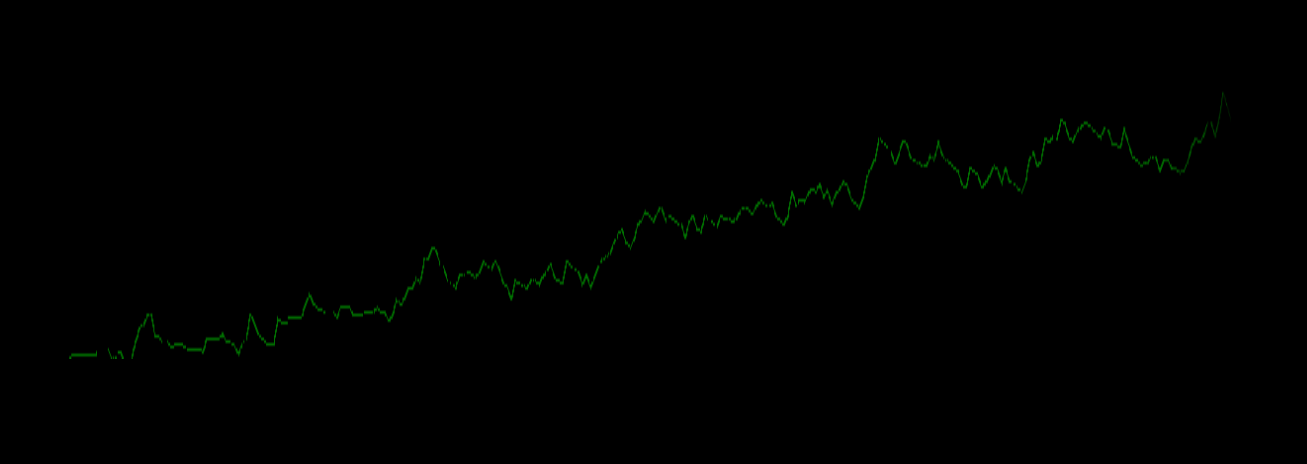
graph standard is a HTML 5, JavaScript and CSS graph visualization using HTML div elements and a JSON dataset. software…
-
graph canvas | canvas
graph canvas is another HTML 5, JavaScript and CSS graph visualization implemented using the Canvas API. The dataset is a…
-
graph svg | multiple
this graph svg visualization allow an unlimited number of independent lines to be drawn using the DOM’s SVG API along…
-
graph zero one | stark contrast
graph zero is a cubic bar graph visualization showing the use of our friends HTML 5, JavaScript, and CSS to…
-
graph zero two | mirrored landscape
graph zero two shows the power of HTML 5, Javscript, and CSS working to create a pretty visualization of our…
-
graph zero three | three dimensions
graph zero three is another bar graph visualization of our JSON dataset in three dimensions, courtesy of HTML 5, JavasScript,…
-
graph zero five | rotate
the user rotates our graph zero five visualization along the X, Y, and Z axes by way of HTML 5,…
-
graph zero six | scale
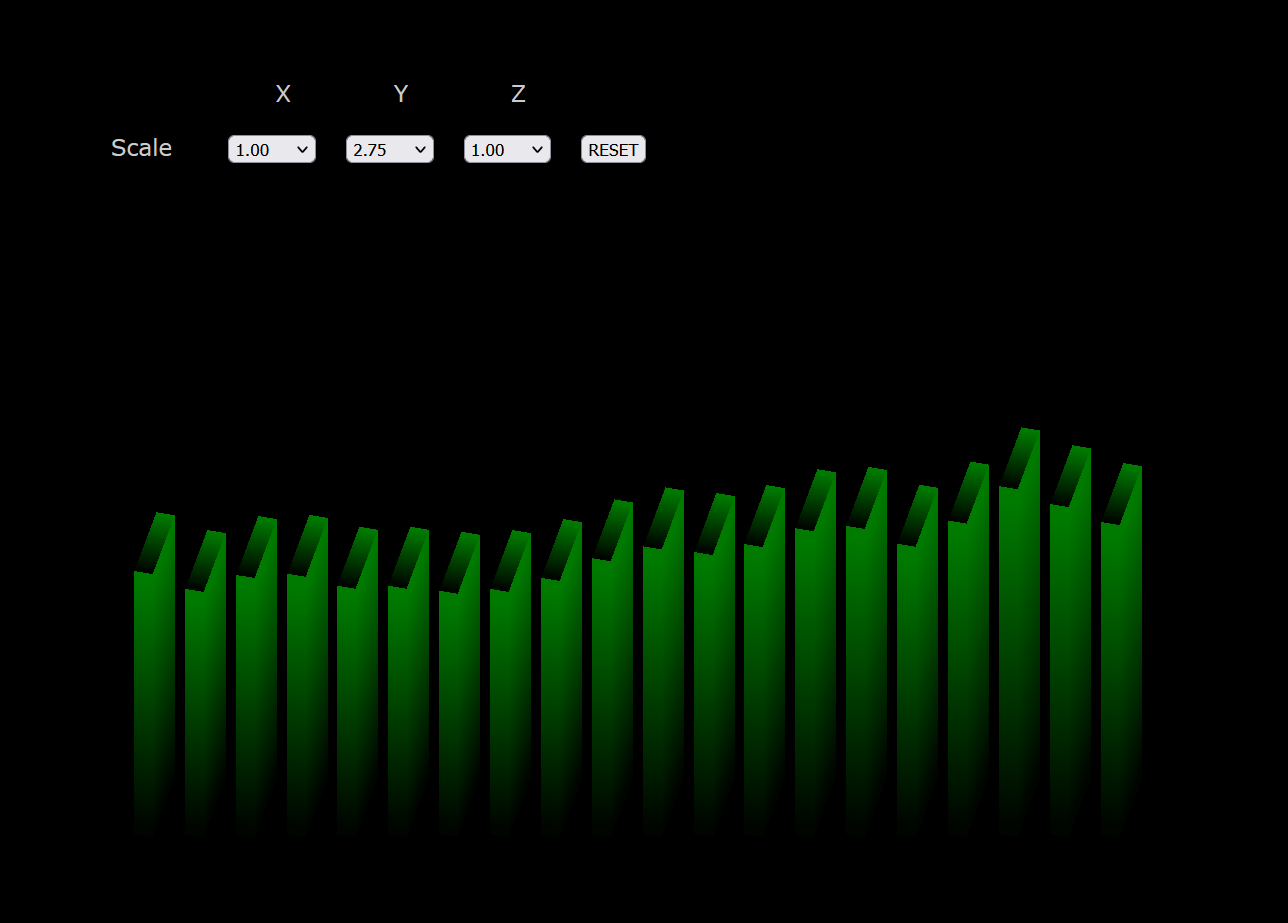
the graph zero six visualization uses our JSON dataset, our base of HTML 5, JavaScript, and the CSS Transform API…
-
graph zero seven | skew
graph zero seven skews our three-dimensional graph along the X and Y axes. HTML 5, JavaScript and CSS provide the…
-
graph zero eight | full traversal
graph zero eight again leverages HTML 5, Javascript, CSS and JSON to achieve full traversal of our three-dimensional dataset visualization.…


